You can connect Google Search Console to Google Analytics 4 (GA4) to get organic search data in your GA4 property.
The integration expands the level of detail you can get from Google Analytics. Once the two platforms are connected, you’ll get performance and ranking data for specific search queries and landing pages. All in one place.
In this guide, you’ll learn how to connect the two platforms. And how to get the most out of the integrated reports.
Why Should You Connect Search Console to Google Analytics?
Google Search Console (GSC) helps you measure organic search performance in Google. So you can uncover SEO opportunities for your site.
You can connect GSC to Google Analytics to get that organic search performance data within your GA4 property. Where you can use it for common SEO tasks like:
- Sharing detailed reports with stakeholders
- Generating new content ideas
- Prioritizing pages that need a content update
The Data You Get When You Connect Search Console to Google Analytics
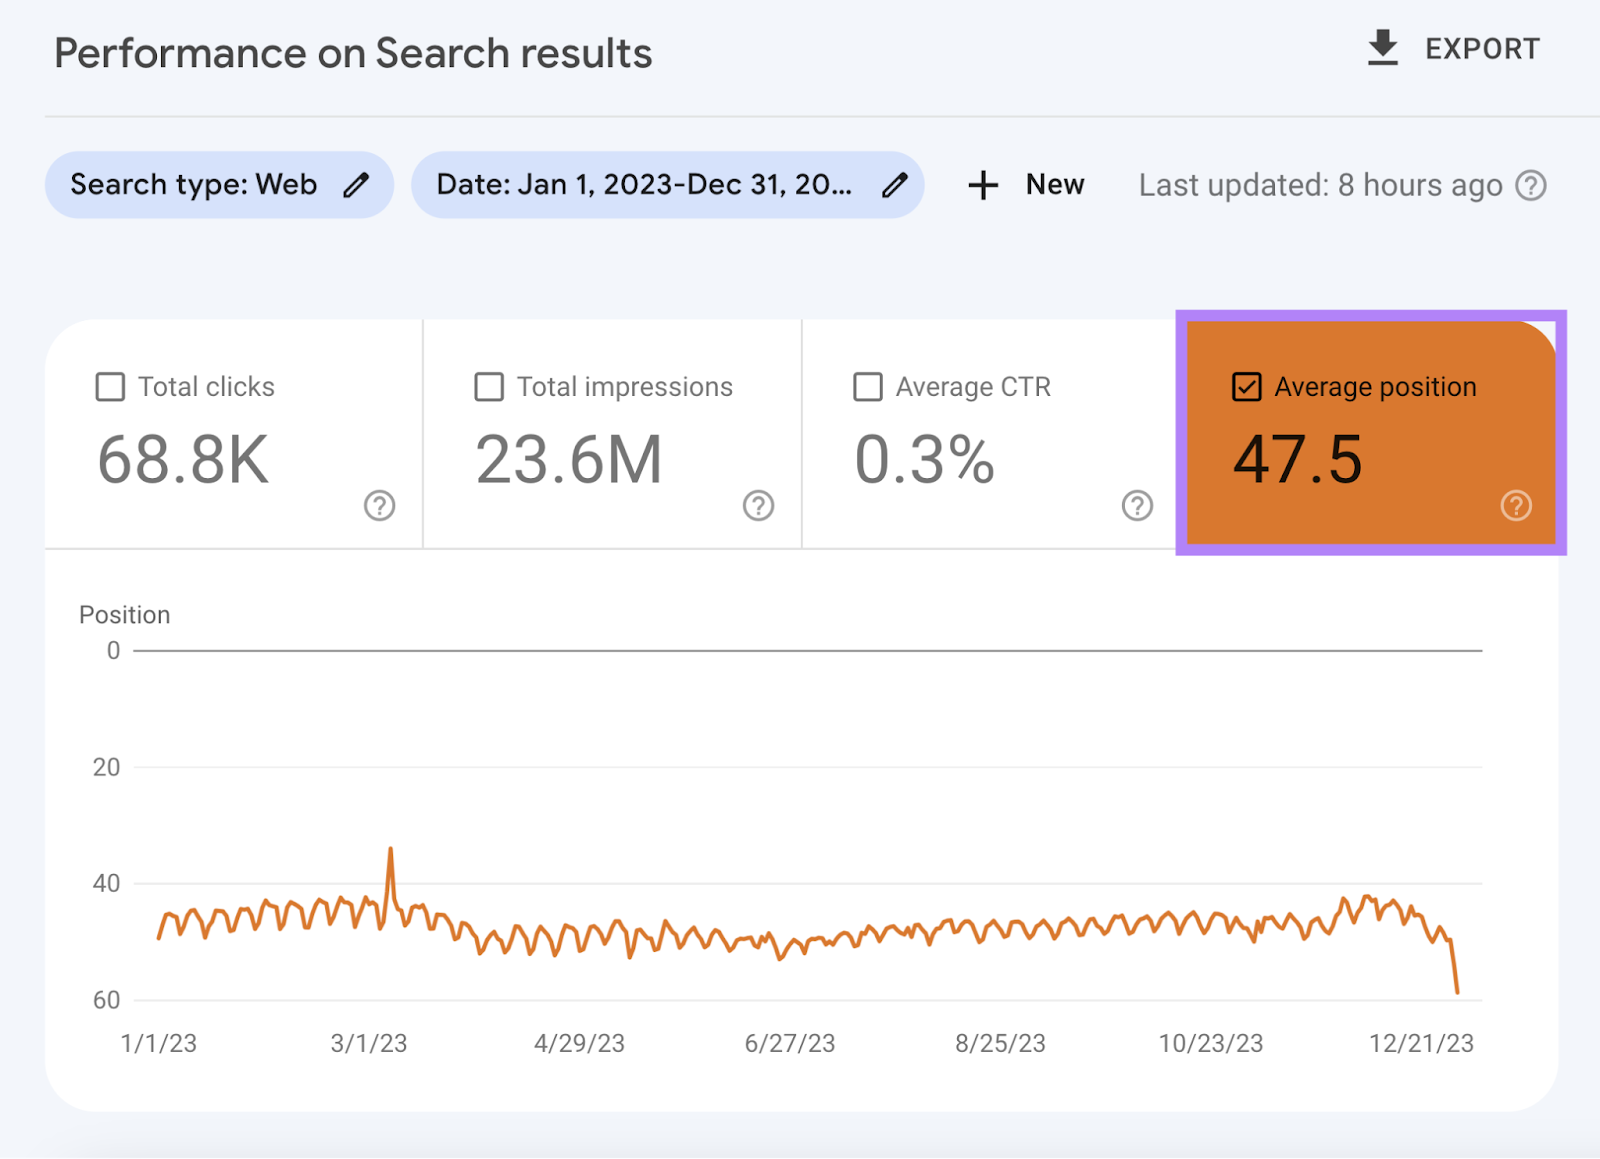
The “Search results” report in GSC displays data for four key performance metrics:
- Total clicks: The number of clicks coming to your site from Google organic search
- Total impressions: The number of times your pages appeared in Google search results
- Average CTR: The number of clicks divided by the number of impressions (multiplied by 100 to give a percentage)
- Average position: The average ranking of where your search results appeared on Google (across all impressions)

By default, the “Search results” report will show a graph of total clicks and total impressions. You can visualize different metrics by clicking into any of the four metrics.
For example, here’s what you’ll see when you turn off clicks and impressions and turn on average position:
These metrics provide an aggregated view of your performance. Search Console provides query-level information on the same four performance metrics.
Queries are the specific search terms visitors typed into Google before finding your site (i.e., keywords). Here is an example showing the top search queries.

On its own, Google Analytics can’t display this granular, keyword-level data.
Why Google Analytics Needs Search Console Data
Google Analytics is a free web analytics tool that can help you understand your website’s performance and the visitors who come to it.
Like where they live, how often they visit, how they arrive, and what they do on the site.

But without connecting Google Search Console to Google Analytics, you won’t be able to see that all-important query-level data alongside your user behavior metrics.
So let’s find out how to combine the two platforms.
How to Connect Google Search Console to Google Analytics
You’ll need editor-level access to your Google Analytics 4 property before you begin.
1. Verify Your Google Search Console Property
You need to be a verified owner of your Google Search Console property to link it to your GA4 property.
You can verify ownership in various ways depending on the specific way you set it up. These include verifying via HTML tags or by adding a TXT record via your DNS (domain name system) provider.
For a full guide on setting up GSC if you haven’t already, check out our Google Search Console tutorial.
2. Go to Google Analytics and Access ‘Search Console Links’
Sign in to Google Analytics using the same Google account you use for Google Search Console.
From the home screen, click on the gear icon in the bottom left to access the “Admin” section.

Click “Product links” under your “Property settings.”
Scroll down and click “Search Console links.”

3. Choose Your Search Console Property to Link
On the “Search Console links” screen, click the “Link” button at right-hand side.
You’ll only be able to link a Search Console property to a single GA4 property.
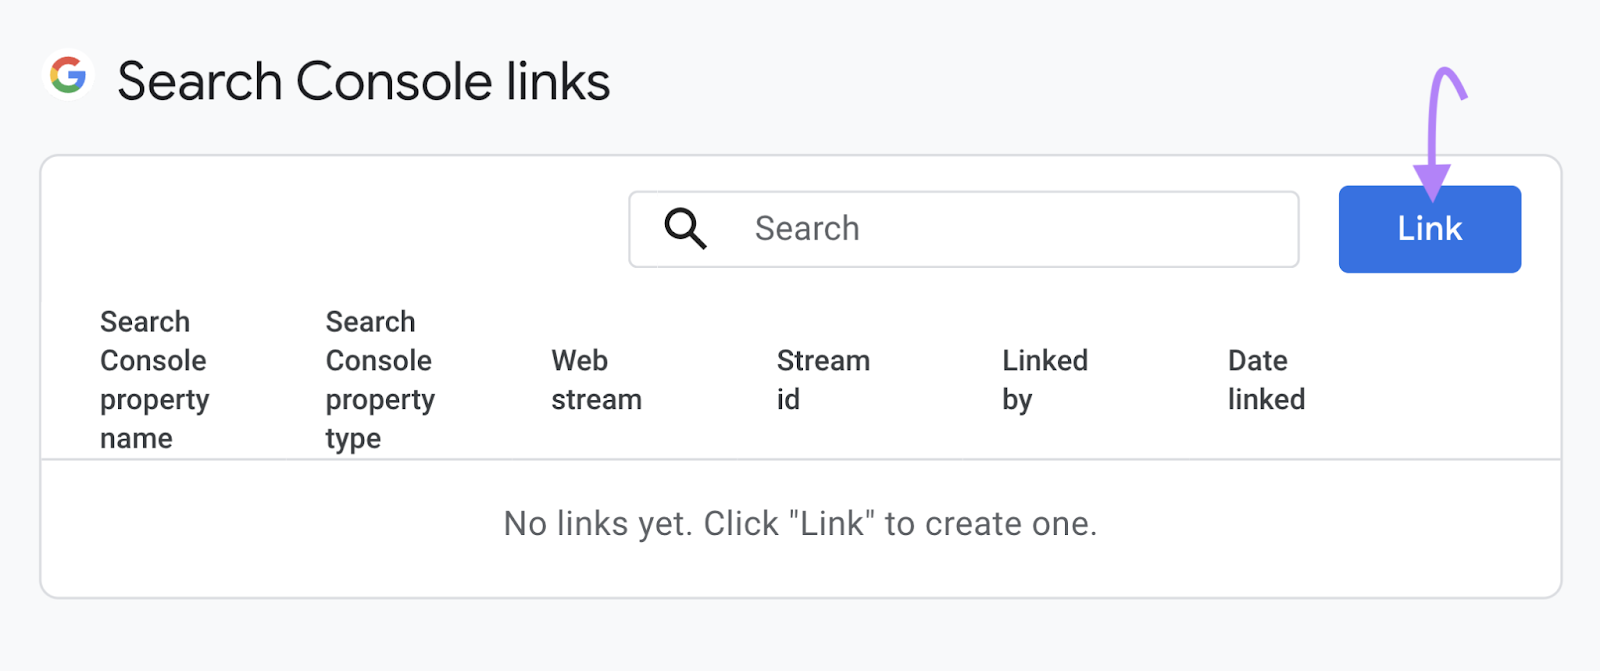
You’ll see a “Link setup” page like the one below.
Click “Choose accounts” to see a list of Search Console properties. You will see all properties in which your email address is a verified owner.
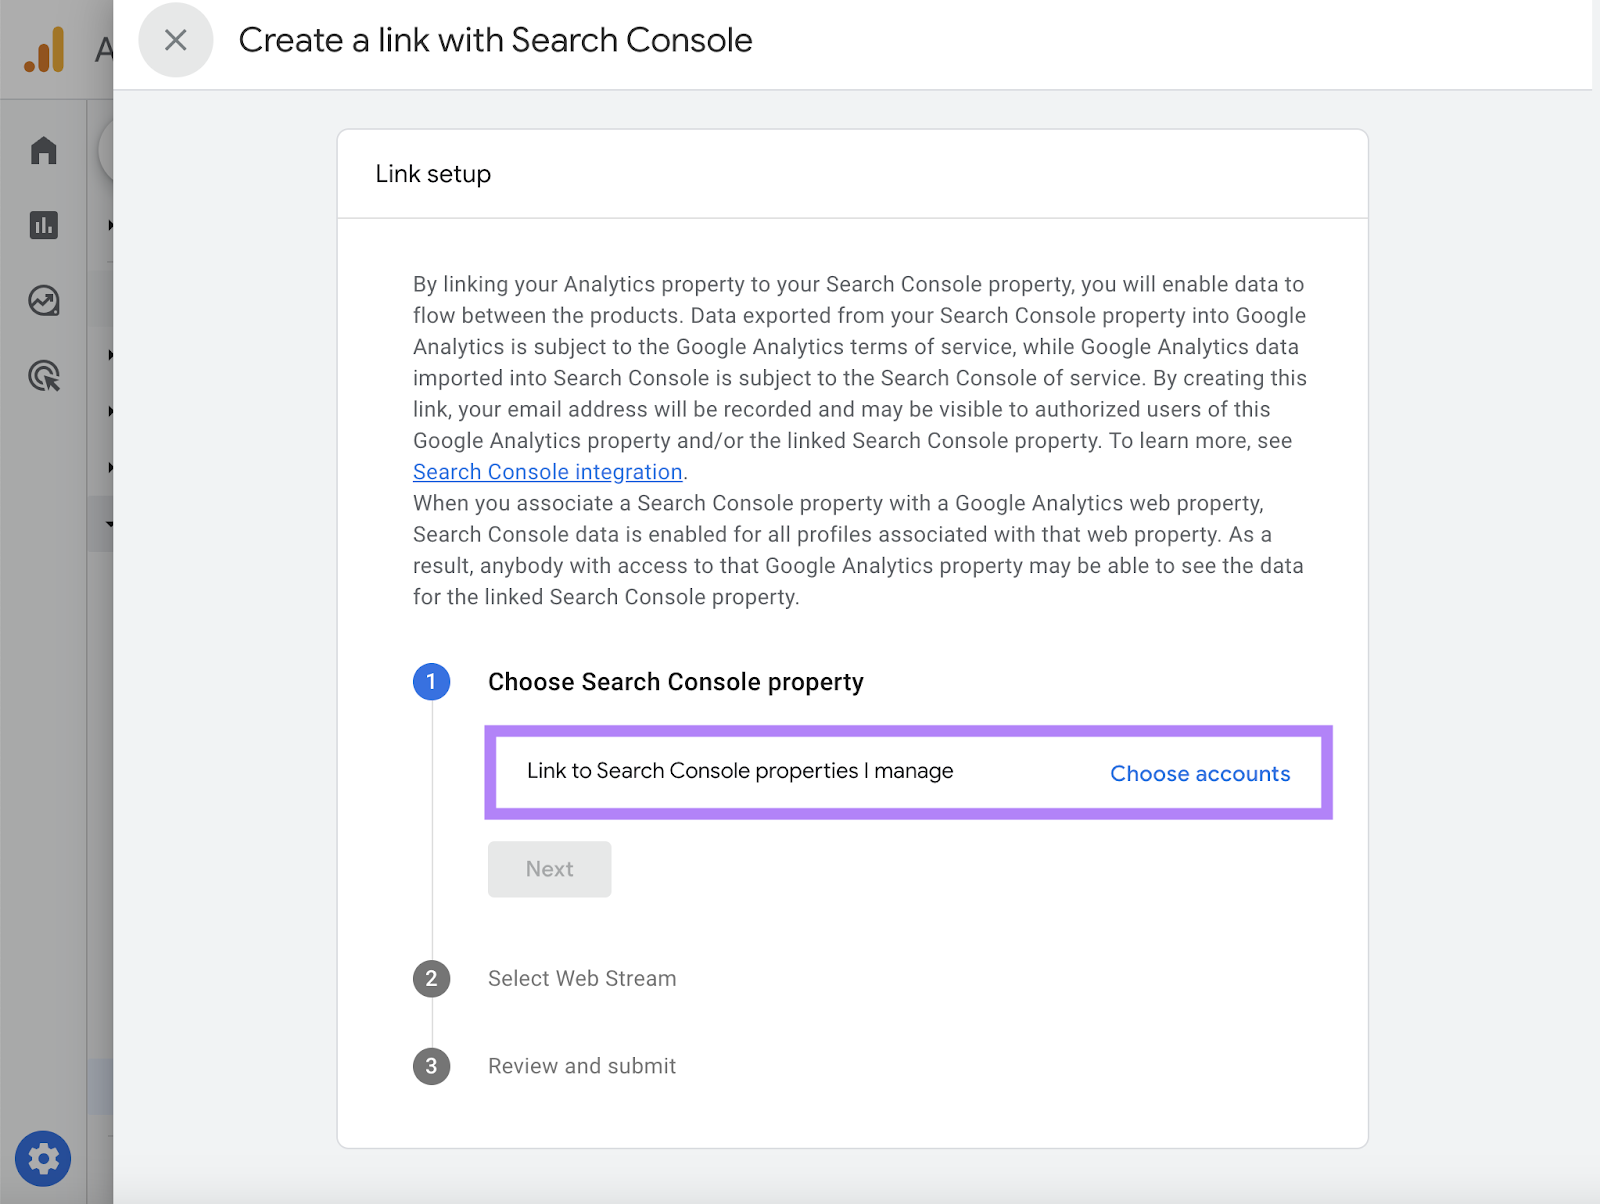
Find your property and select it using the checkbox on the left of the “Property Name.” Then, click “Confirm.”

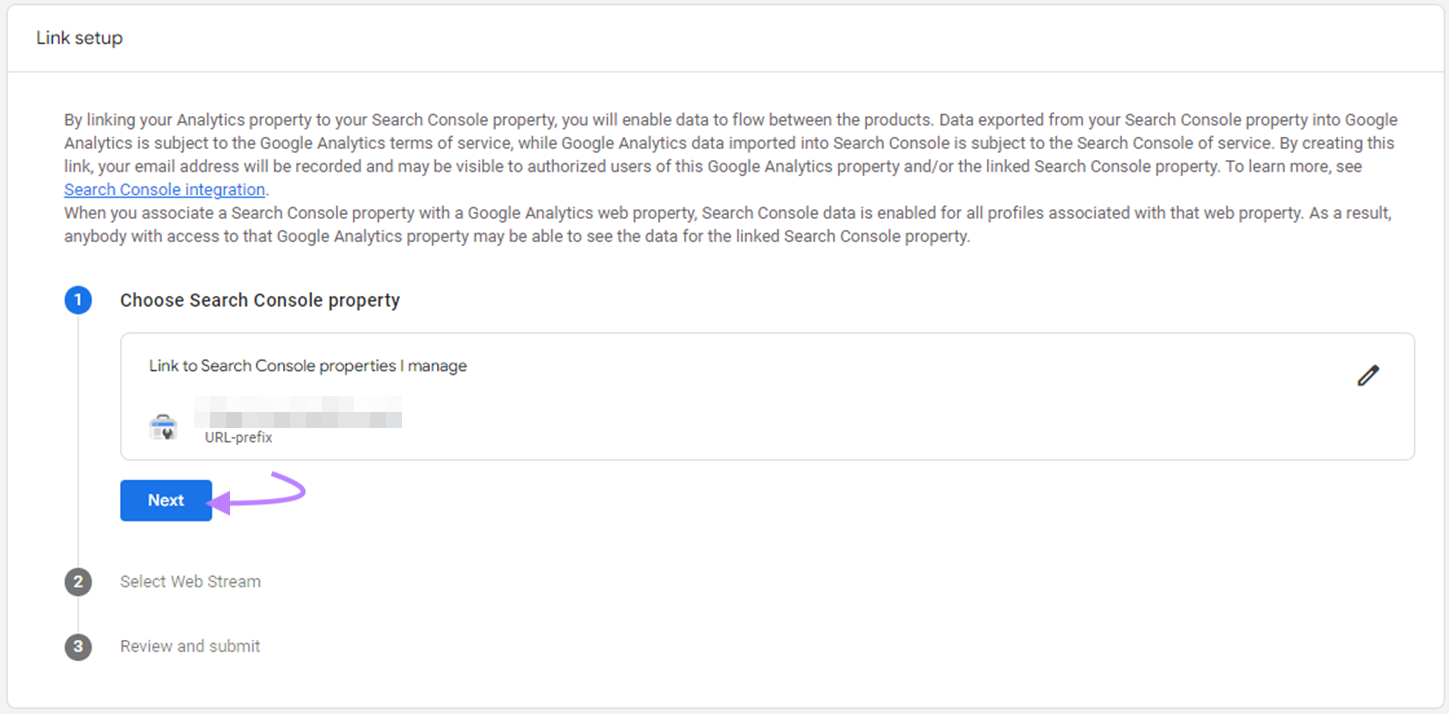
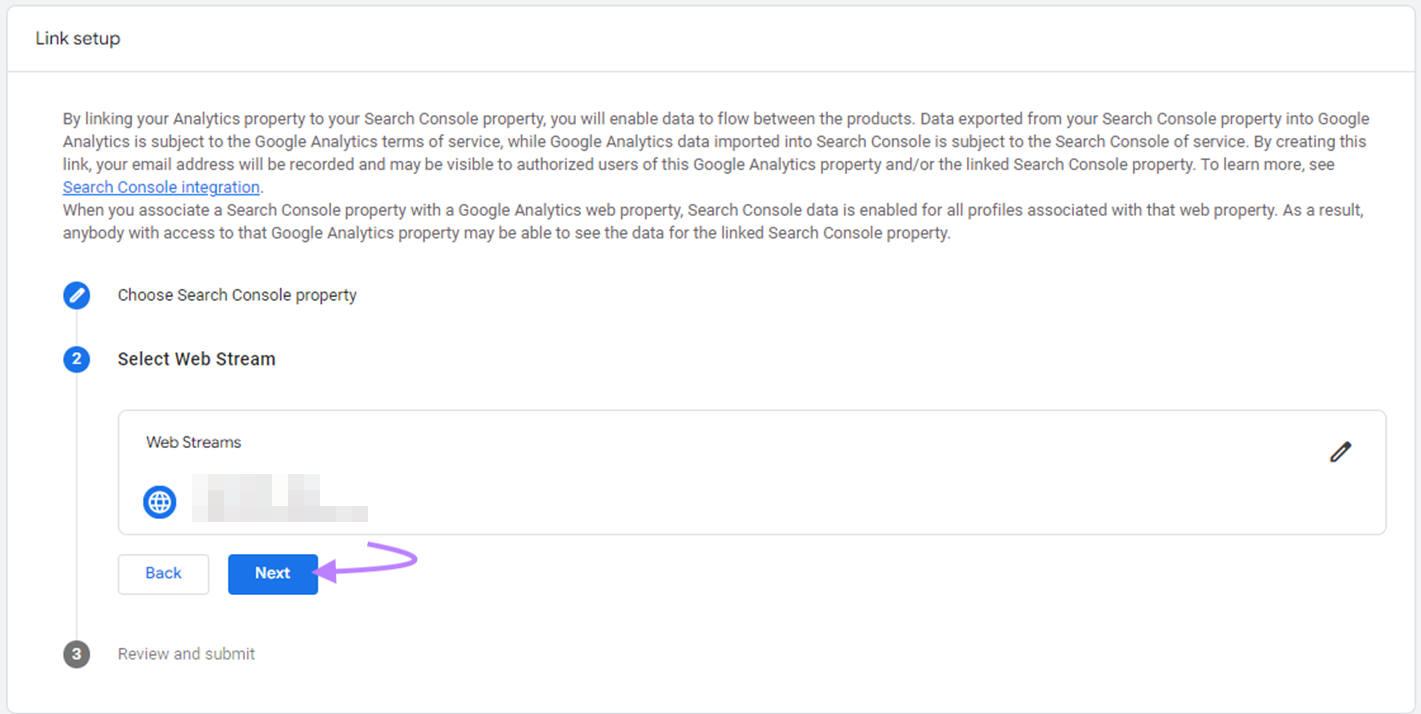
4. Pair Your Search Console Property with Your GA4 Web Stream
Next, you’ll pair your Search Console property with your Google Analytics web data stream.
A data stream is the place from which your Google Analytics data originates. Google Analytics 4 has three types of data streams:
- iOS app
- Android app
- Web
You can only connect Google Search Console to a Google Analytics 4 web stream (i.e., for a website, not an app). Click “Next.”
Then, click “Select” to choose your Google Analytics web stream.

You’ll see the relevant web data stream in your GA4 property. Click it.
Click “Next” again.
5. Review and Submit Your Search Console Link
You’ll see a final review screen like the one below.
Click “Submit” to complete the Search Console integration.

6. Publish Your Reports
You need to publish your Search Console reports so you can find them within the “Reports” area in the left-hand navigation of GA4.
To do that, click “Reports.”
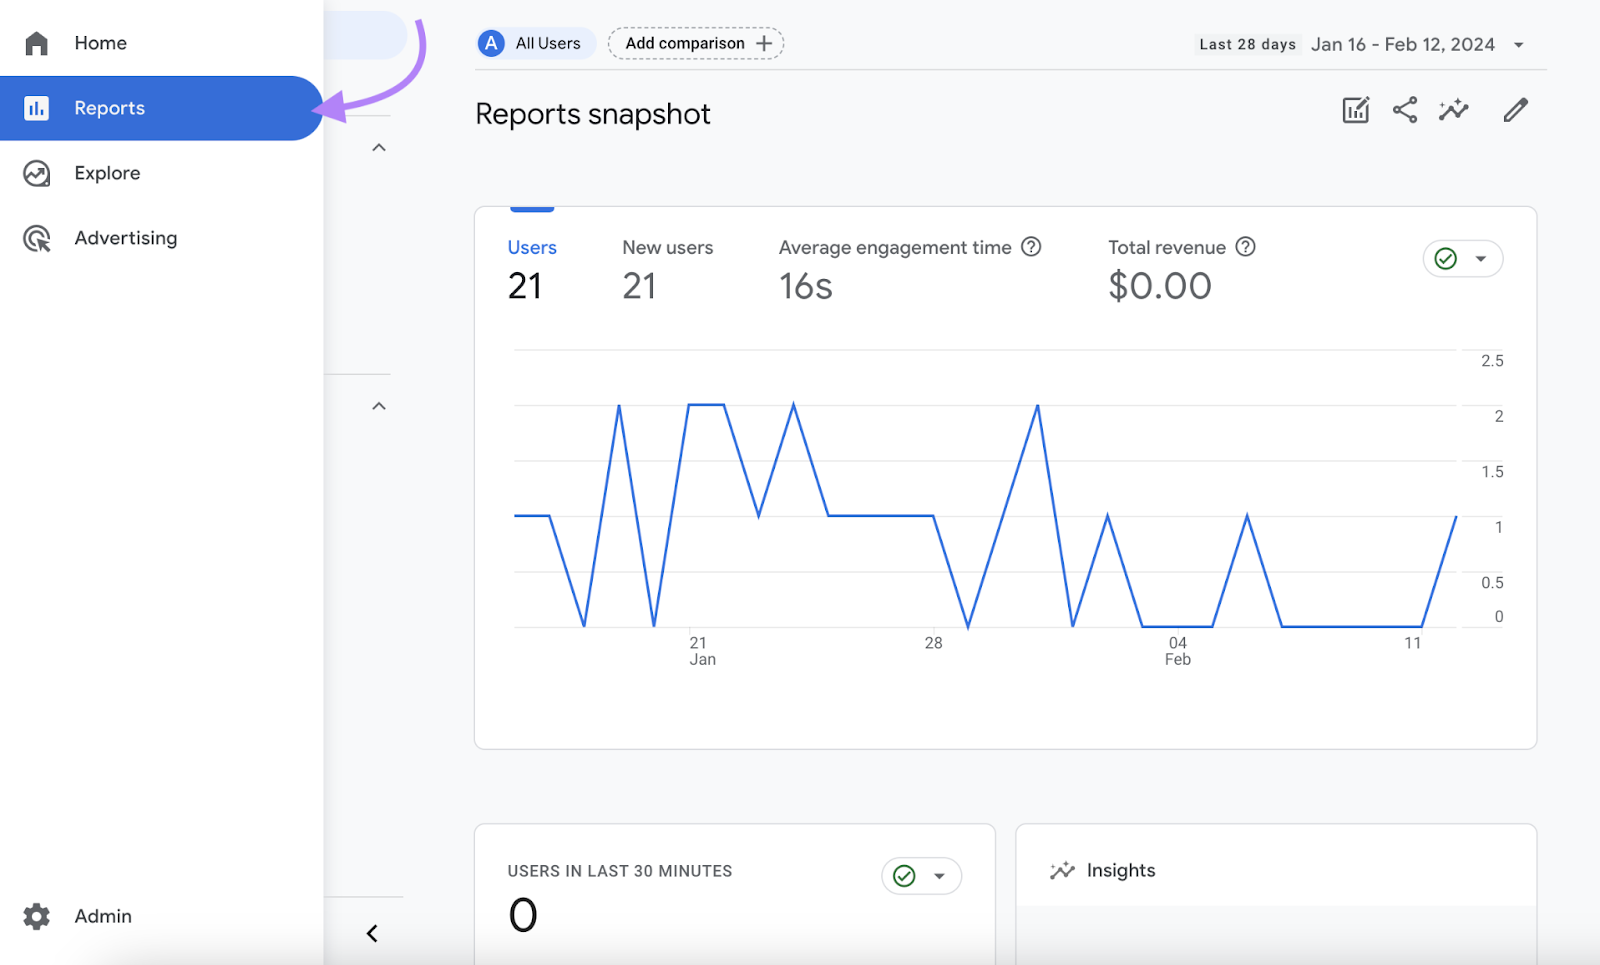
Then, click “Library” to access your available reports.
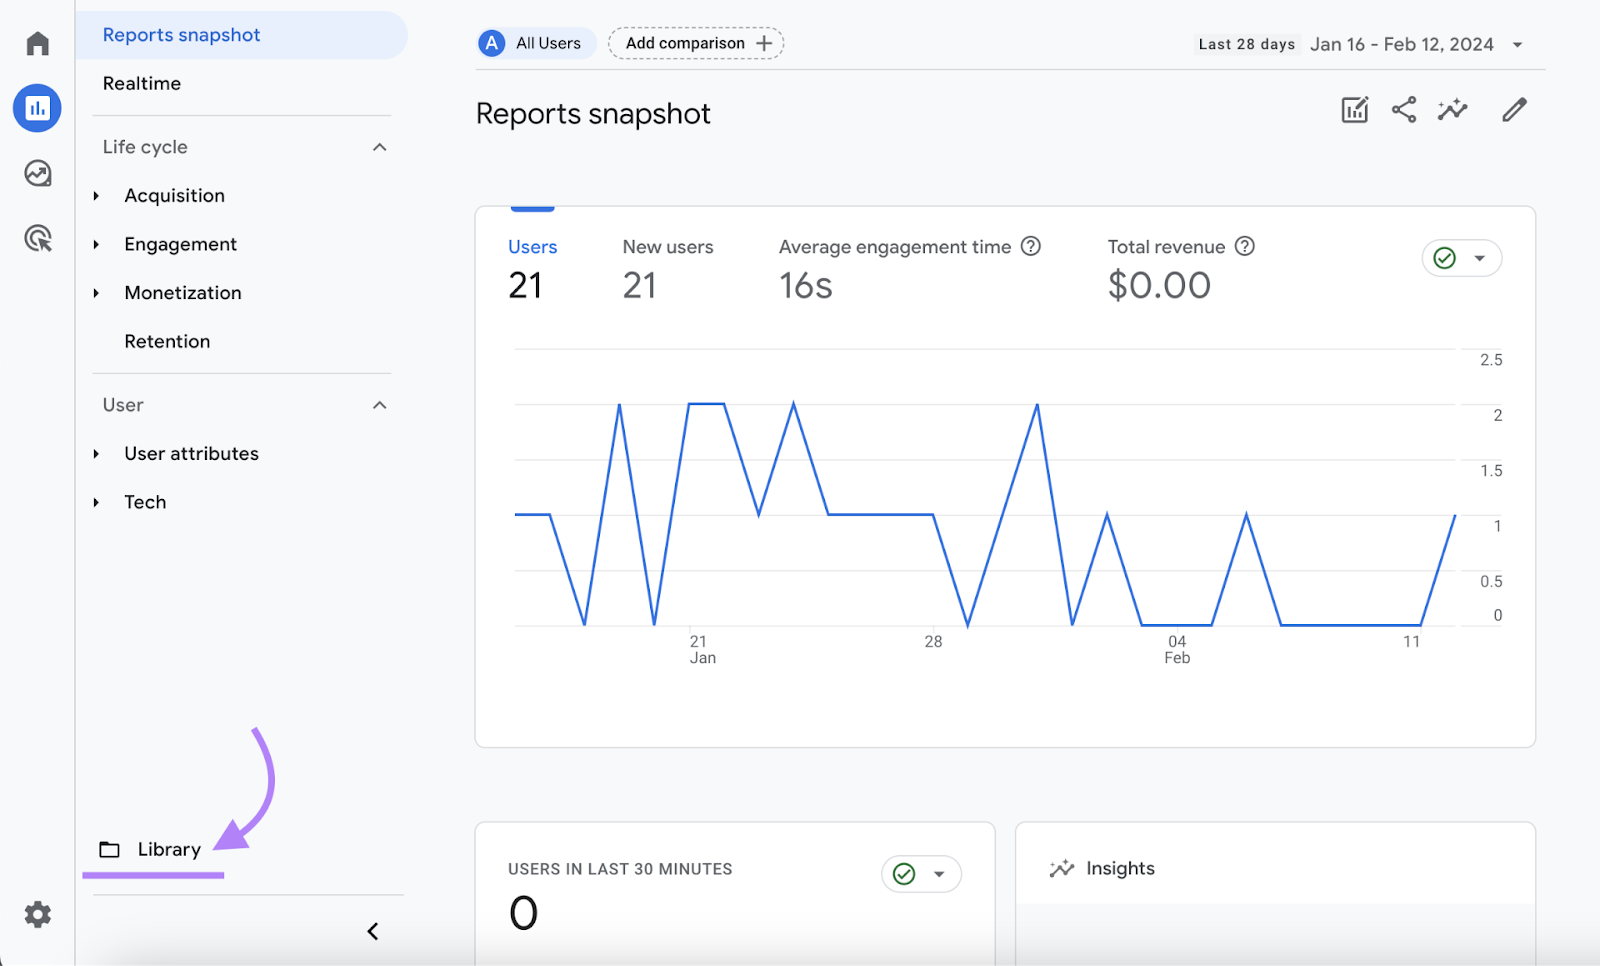
You’ll see “Search Console” within your “Collection.” It may show an “Unpublished” status. (If it shows as “Published,” Google has already done your work for you, and you don’t need to do anything else here.)
Click the vertical three-dot icon.

Then, click “Publish.”

Now that you’ve connected GSC and GA4, let’s see how you can use your new data.
How to Use Search Console Reports in GA4
Your Search Console data appears in two different reports in GA4:
- Queries report
- Google organic search traffic report
You can now find both of these by clicking “Reports” within the primary left-hand navigation.
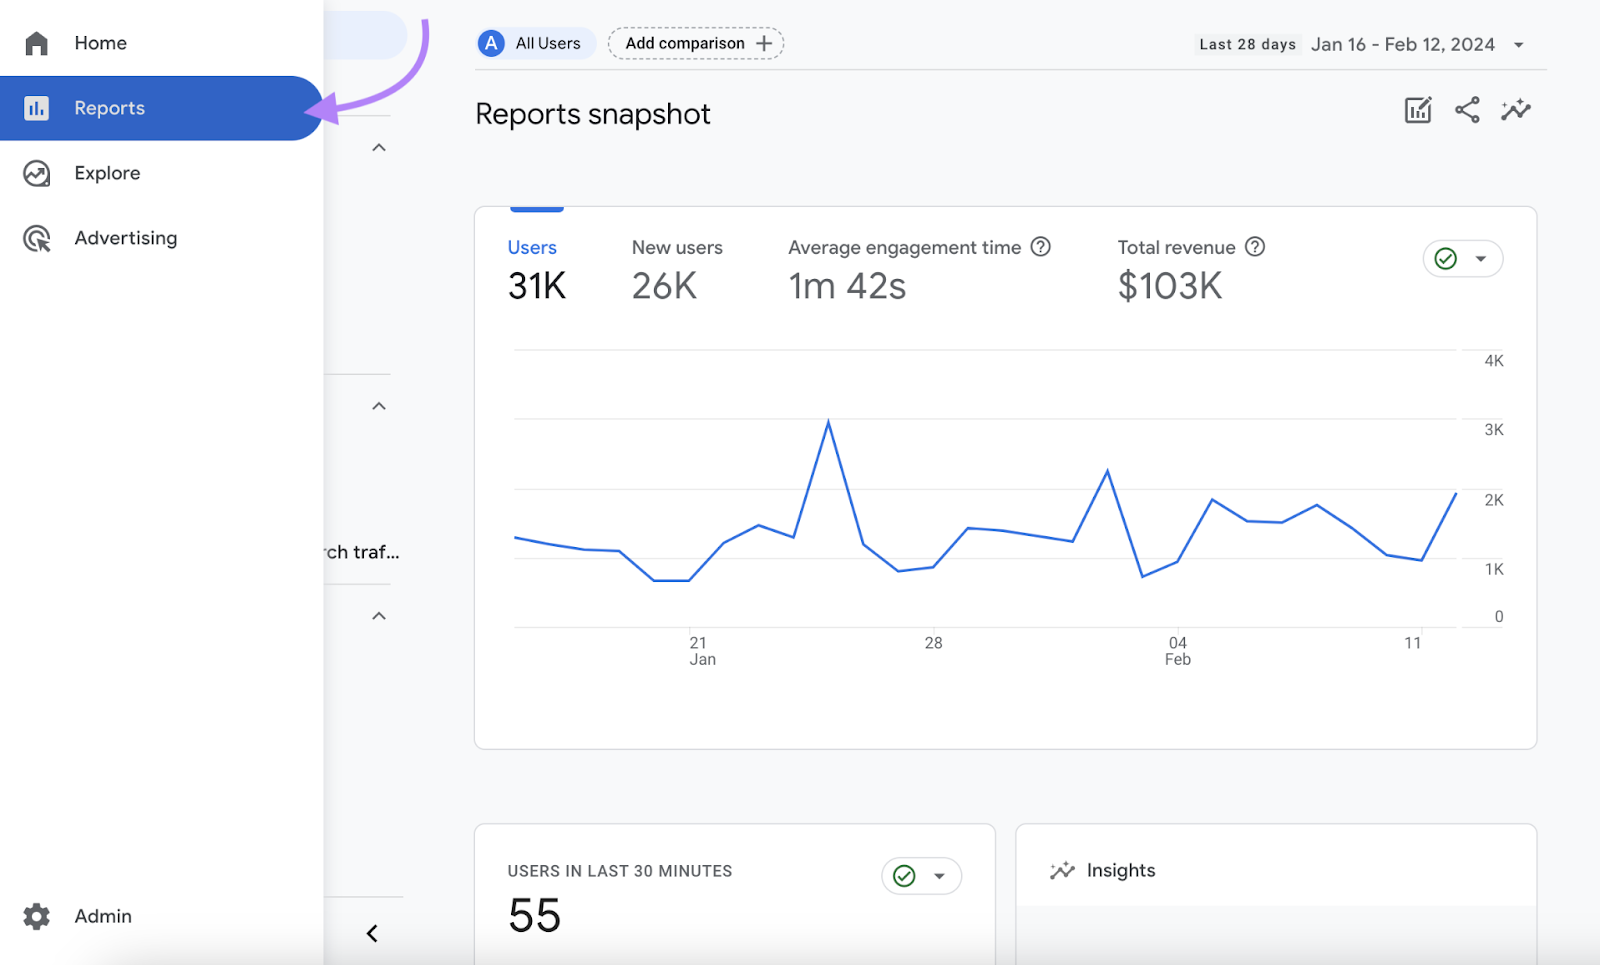
You’ll see your “Search Console” section below your “Life cycle” reports. Click on it to expand the individual reports.
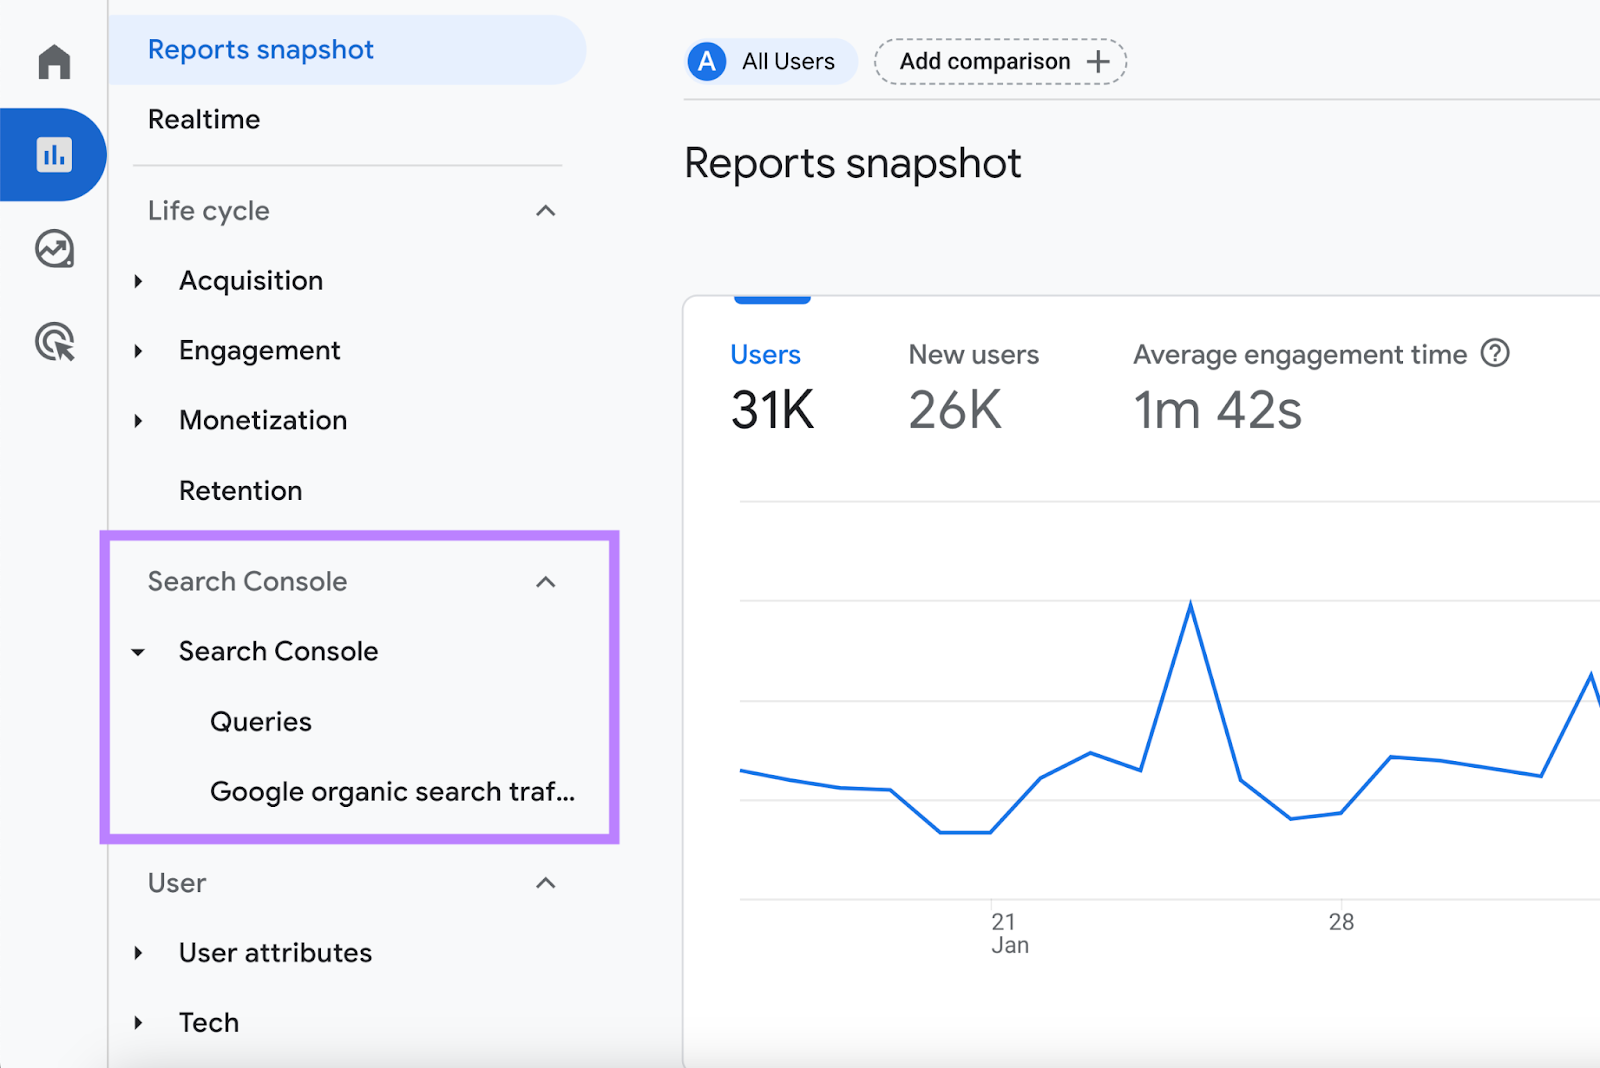
You’ll see both the “Queries” report with keyword-level data, and the “Google organic search traffic report,” which has landing page data.
Let’s start by looking at the Queries report.
Search Console Queries Report
The Queries report tells you about the specific search terms your visitors typed into Google before finding your site.
It can help you understand more about the needs of your visitors. And track how your site is ranking on Google for the individual keywords they are looking for.
You can also identify pages where your rankings are dropping. These can be great places to update your SEO efforts.
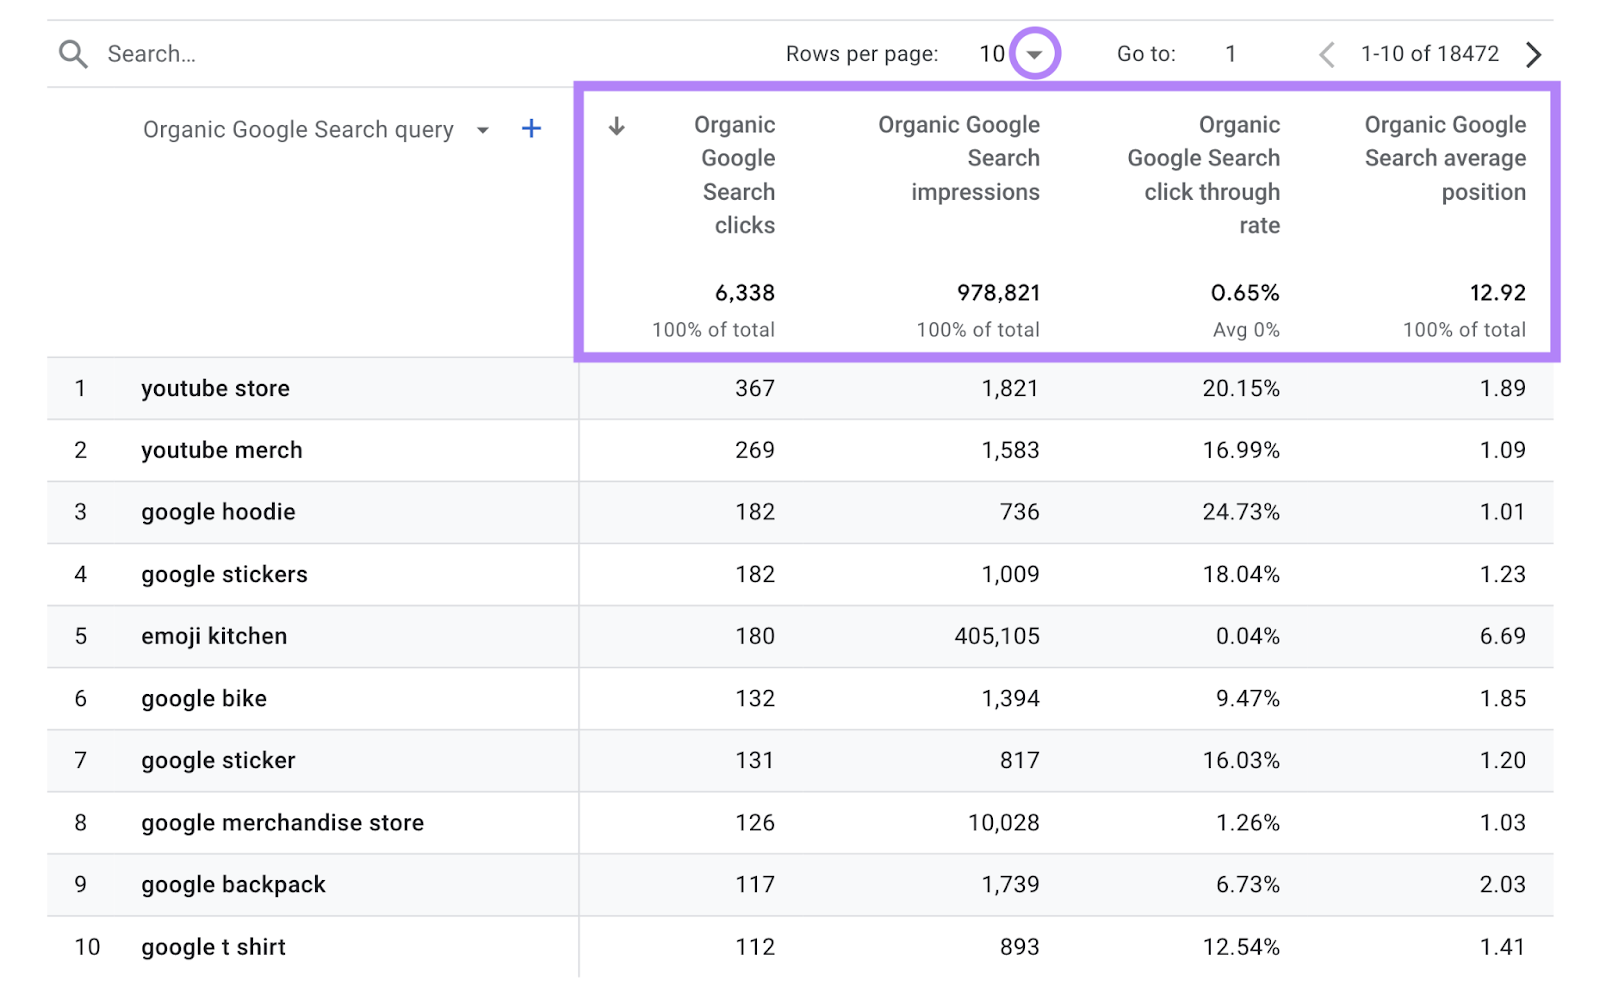
The report shows the same four metrics we reviewed earlier in this article, albeit with slightly different names:
- Organic Google Search clicks
- Organic Google Search impressions
- Organic Google Search click through rate
- Organic Google Search average position
By default, you’ll see your top 10 Google organic search queries ranked by the number of clicks each one received within the given time frame.
You can click the drop-down arrow to the right of “Rows per page” to display more queries.
On its own, the report provides a snapshot of your website’s Google organic search performance. You can use the date range selector to analyze your performance over time.

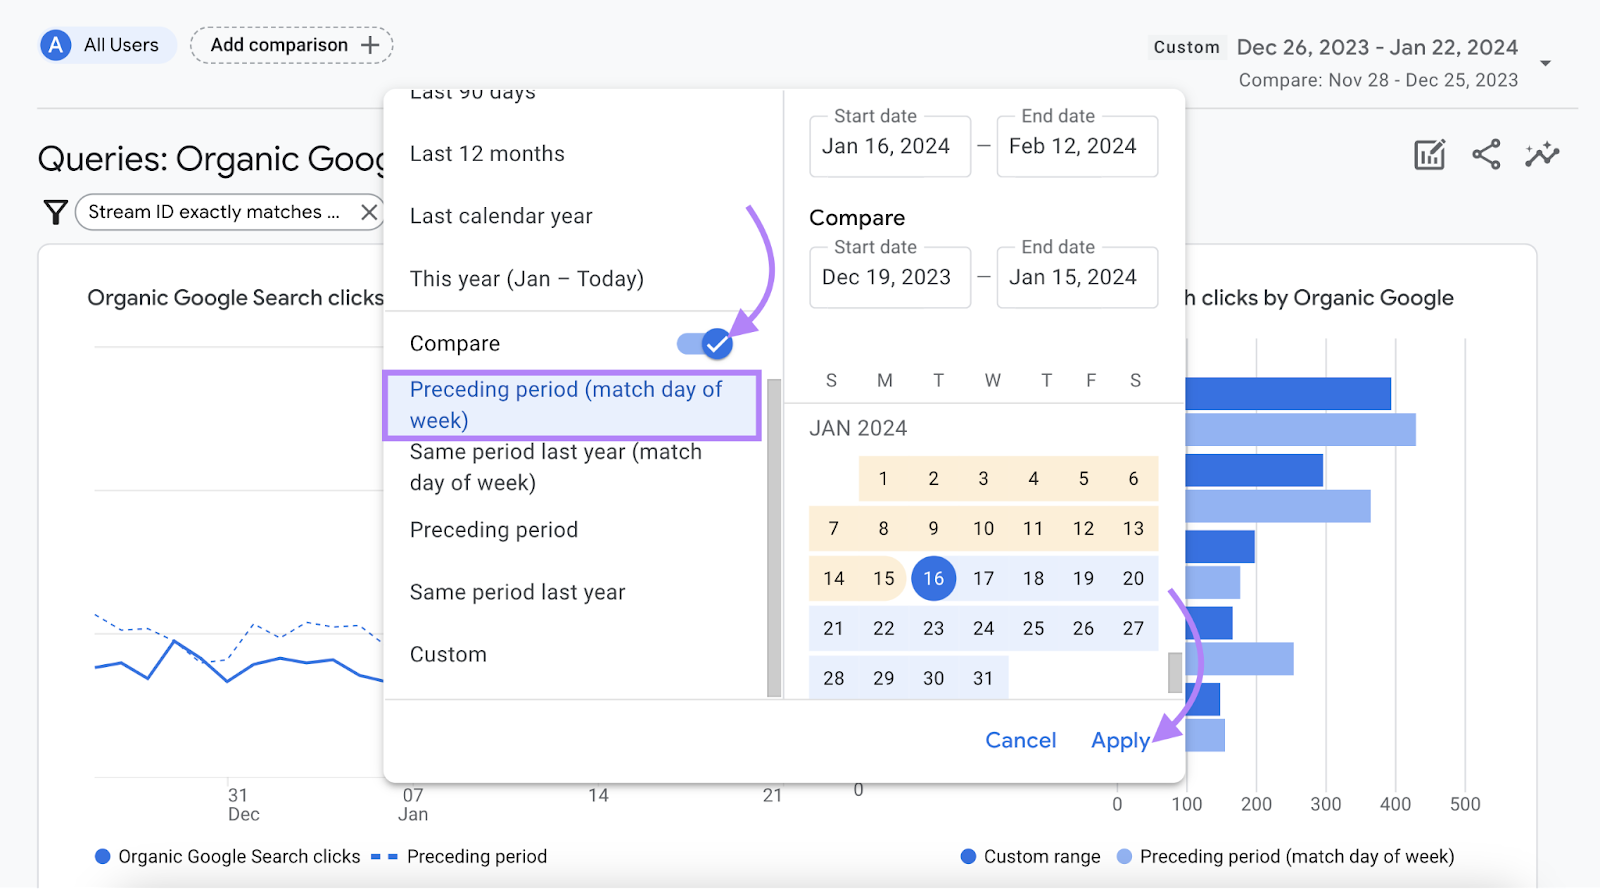
By default, you’ll see the past 28 days’ worth of data. You can get more detailed information by adding a comparison to your date range.
For example, you might want to compare your recent performance to the preceding 28-day performance.
Use the “Compare” toggle to add a date range comparison.
The default comparison is the immediately preceding period. In our case, the 28 days before the most recent 28-day period. You can do a year-over-year analysis or use a custom time frame.
We’ll use the default comparison. Click “Apply.”
You’ll see three rows for each of your search queries:
- Your primary time range
- Your comparison time range
- The percentage change over time
The third search query stands out in this example:

You’ll notice that it’s one of the site’s top click performers despite its low click-through rate. It represents almost half of all the site’s Organic Google Search impressions (473,990 out of 958,562).
Clicks also increased by 9.55%, despite the rankings drop during that time (going from an average position of 6.19 to 6.35).
This indicates that search interest is increasing for this term, but the page is likely not well-optimized. Which we can tell from the low click-through rate and dropping rankings.
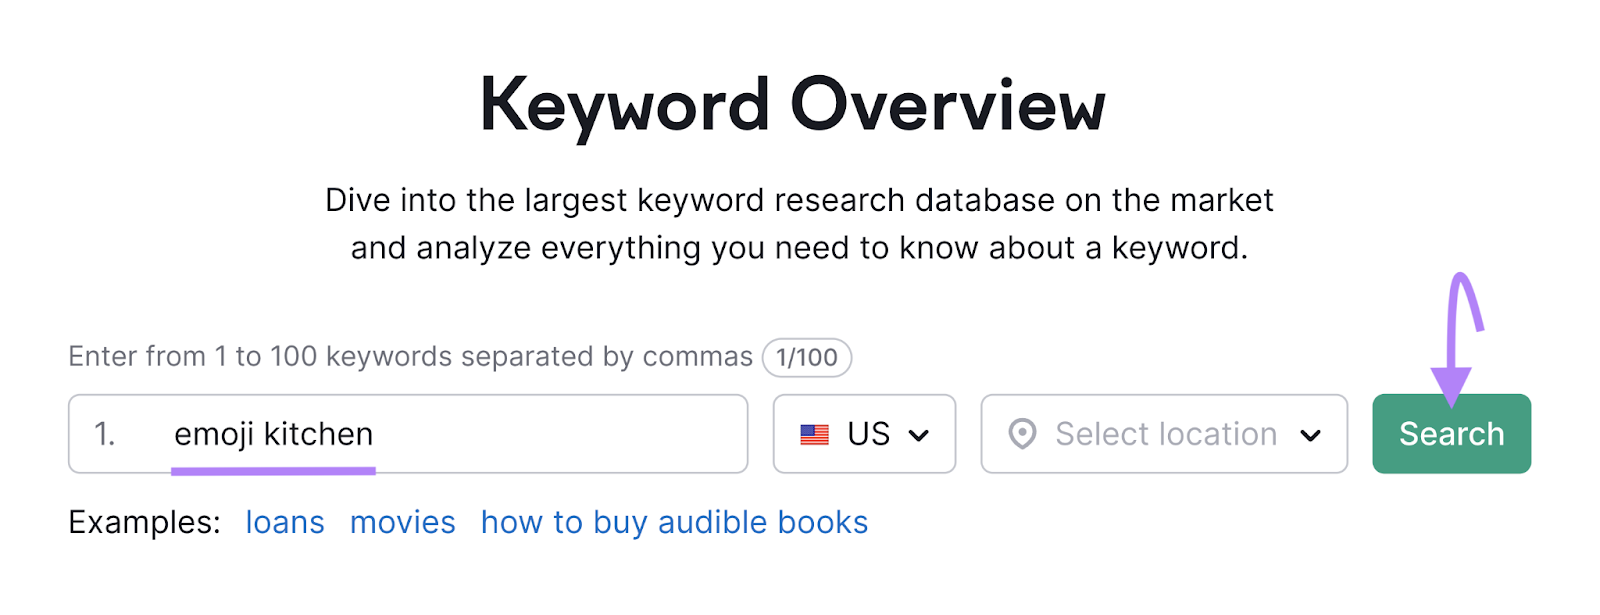
It could be worth reviewing this piece of content to see if you can further optimize it for that search query and increase your organic traffic. And you can use Semrush to help with that.
In this example, we’ll use the Keyword Overview tool to learn more about the “emoji kitchen” keyword.
Type your keyword into the blank field. Then, click “Search.”
You’ll then get helpful metrics about the keyword. In this case two pieces of information are especially interesting:
- Volume (the average number of monthly searches) is 135k in the U.S., but if you look at “Global Volume,” you see there are three other countries that have at least that much search interest
- Trend shows the estimated interest over the preceding 12 months (Interest in this spiked recently.)

You don’t know what the future trend will look like. But if you optimize for the keyword now, you’ll be better positioned to drive a greater share of clicks if that trend continues.
And you may want to consider optimizing for search in Turkey, India, and Japan, where search volume is equal to or greater than that in the U.S. for this term.
The “Keyword Ideas” section of the report can provide ideas to further optimize your existing page.
One simple way to do that is to use the “Questions” data. These are search questions that include a variant of your keyword.

You could use these terms to add an FAQ section at the bottom of your page to address these specific questions. This could help your page rank for those related keywords, while providing additional value to your readers.
Google Organic Search Traffic Report
The Organic Search Traffic report tells you about your top landing pages in Google organic search.
It uses the same four metrics as the Queries report and combines them with more metrics from Google Analytics. These GA4 metrics tell you information like each page’s engagement rate, and the number of GA4 events tracked on each page.

The fifth landing page on the list looks like it’s the page where the “emoji kitchen” keyword is ranking. The “Engagement rate” for this page (42.47%) stands out because it’s much lower than the average across all pages (64.32%).
Engagement rate is the percentage of sessions where a visitor satisfied at least one of the following conditions:
- Viewed more than one page
- Actively engaged with the page for at least 10 seconds
- Completed a conversion (such as buying something or filling out a form)
The low engagement rate tells us that these kinds of valuable visits are happening less frequently on this page. This suggests you might want to update it to make it more helpful for your readers.
Take Your Organic Search Data Further with Semrush
Get useful keyword insights alongside your Google Search Console and Google Analytics data all in one place with Semrush.
Organic Traffic Insights combines three important sources of information:
- Data from Google Search Console and Google Analytics for your top landing pages
- Conversion data from Google Analytics so you can see which of those pages drive the most conversions
- Keyword ideas powered by Semrush so you can find ways to drive more traffic and get more conversions

Look at the second landing page in the list. It accounts for over 35% of all your organic search conversions (41 out of 116) and 2.4% of all sessions for that page result in a conversion (41 out of 1,708). You also see that your sessions and your conversions are falling.
You want to use keyword data to find opportunities to improve your rankings and drive more traffic. To do that, click the hyperlinked number (129 in this case) to view Semrush keywords driving traffic to that page.

This will take you to a page showing keywords along with various metrics for each, including two that Google Search Console doesn’t show:
- Volume (estimated number of monthly searches)
- Keyword Difficulty (an estimate of how hard it would be to rank well for each keyword in organic search results)
You can use both of these metrics to find new keywords to target. You focus on the fifth keyword in the list, “ga4 active users.”

You see it has a Keyword Difficulty of 20%, which is lower than keywords for which you are already ranking in the first position on Google. Yet, your page is only ranking in the sixth position on Google for this term.
This could make it a prime candidate for a content update to improve your rankings for that keyword, boost your click-through rate, and get more conversions.
Want to benefit from this kind of data on your own website? Try Organic Traffic Insights for free today.
This post was updated in 2024. Excerpts from the original article by Amit Panchal may remain.